2020 Year in Review
NOAA/NWS Phoenix, AZ -- Updated Jan 28, 2021
Overview
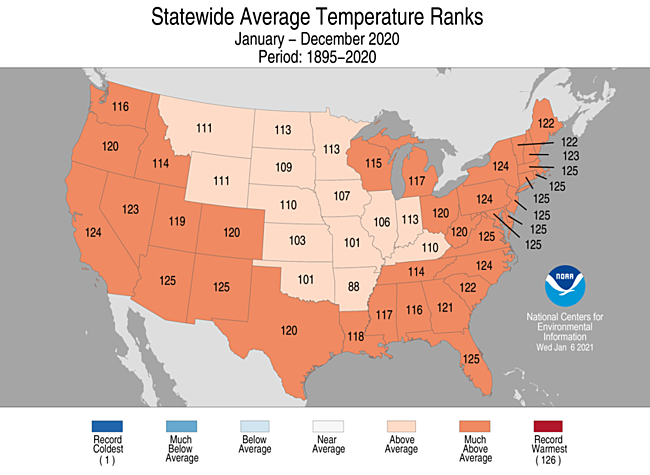
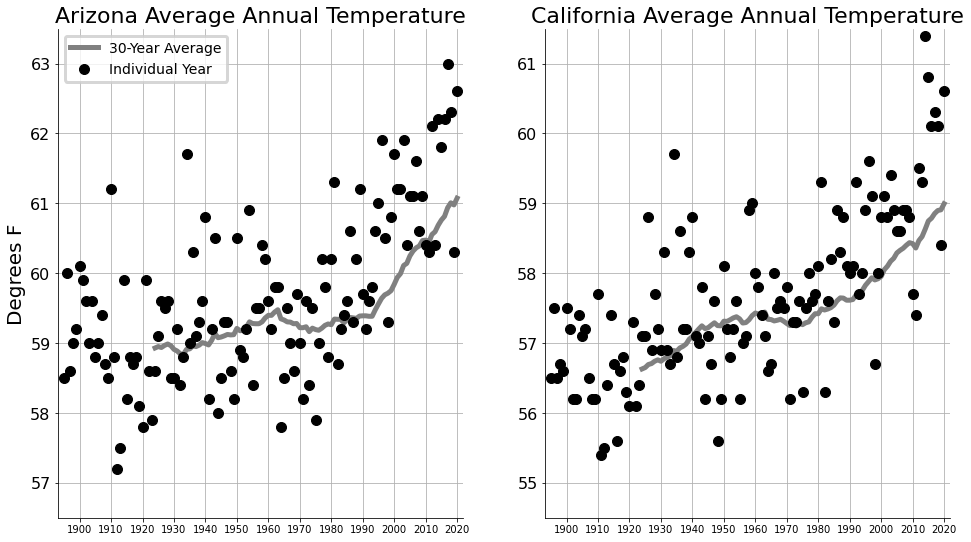
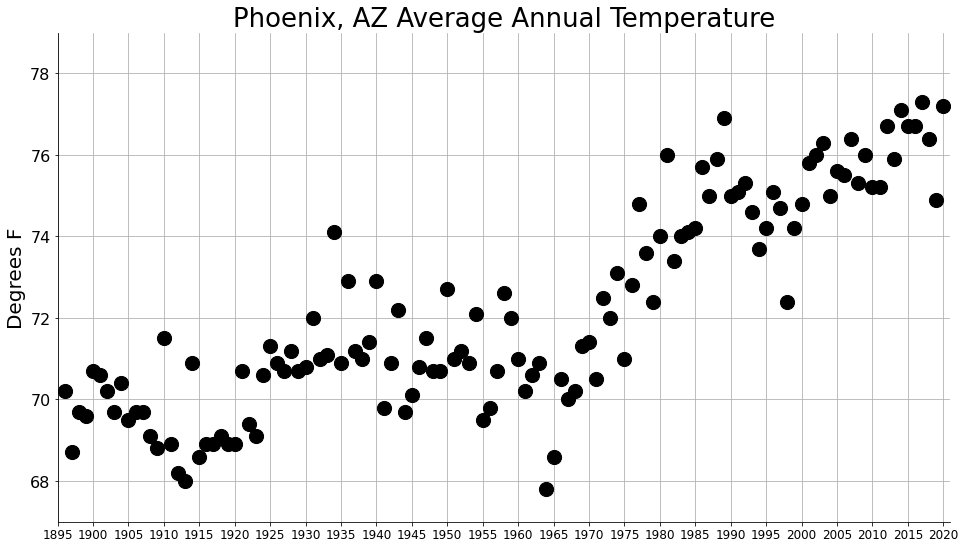
The year 2020 will infamously be known for having the hottest and driest summer/monsoon season on record (since 1895) across the Southwest. Numerous daily temperature records were set across the region, with several new monthly and seasonal records. For Arizona, the year as a whole ended as the second hottest on record with an average temperature of 62.6°F, falling just behind 2017’s record of 63.0°F (Figure 1). Across California, 2020 will rank as the 3rd hottest on record with an average temperature of 60.6°F, compared to the record of 61.4°F in 2014. Temperatures have shown a steady upward trend over the past several decades (Figure 2)
Fig. 1. Map depicting average temperature rank of 2020 by state. Data source: NCEI.
Official rankings are based on data from NCEI (link). Daily temperature values from climate stations across the state are compiled and aggregated into a single state-wide value for each month (Table 1). The twelve monthly values are then averaged for a final annual value. The daily average temperature at an individual climate station is calculated by averaging the day’s high and low temperature.
|
Table 1. Top five warmest years by average temperature (°F). |
||||
|
Rank |
Arizona |
California |
||
|
1 |
2017 |
63.0 |
2014 |
61.4 |
|
2 |
2020 |
62.6 |
2015 |
60.8 |
|
3 |
2018 |
62.3 |
2020 |
60.6 |
|
4 |
2014 |
62.2 |
2017 |
60.3 |
|
5 |
2016 |
62.2 |
2016 |
60.1 |
|
1981-2010 |
60.5 |
58.4 |
||
Fig. 2. Plot of average annual temperatures (black dots) and running 30-year means
(gray line) for Arizona (left) and California (right) for 1895-2020. Data source: NCEI.
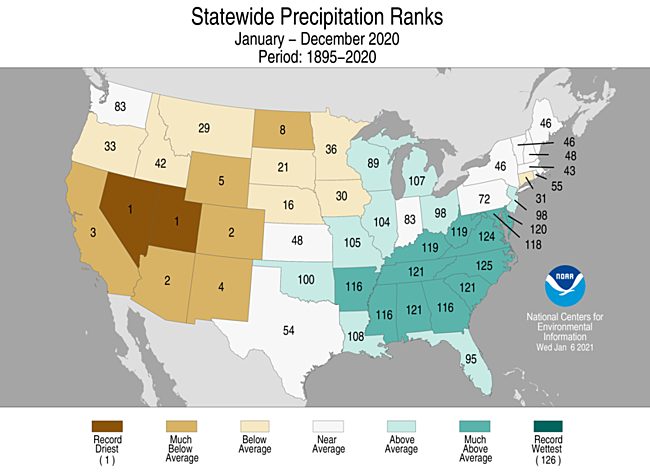
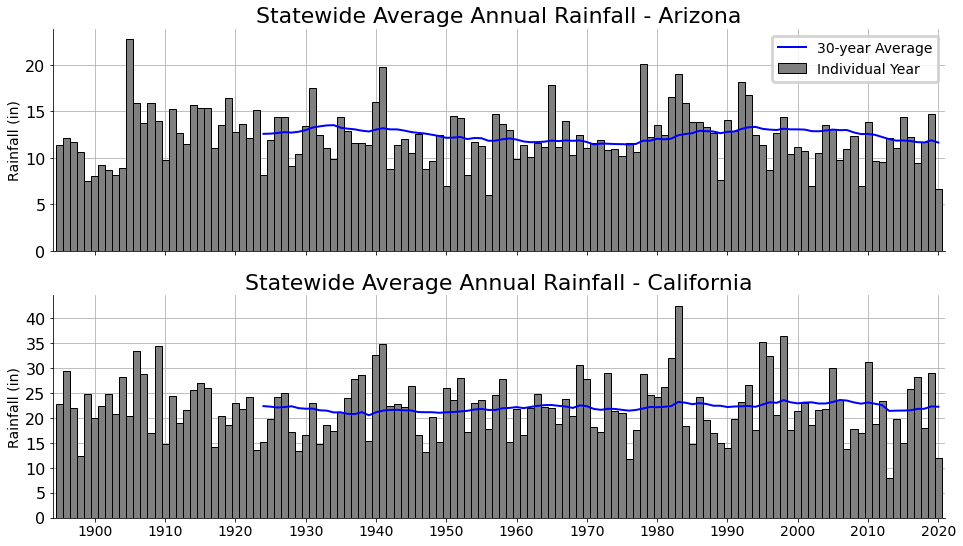
Daily precipitation data from individual stations are summed and aggregated into statewide average monthly values. In Arizona, precipitation during 2020 ranked as the 2nd driest with 6.63" (Figure 3) as compared to the record dry year of 1956 where only 6.04" was averaged across the state (Table 2). Precipitation across California averaged 11.97" which was the 3rd driest, but far from the driest year of 2013 with 7.93". Precipitation values have shown a slight downward trend (AZ, CA) over recent decades (Figure 4).
Fig. 3. Map depicting precipitation rank of 2020 by state. Data source: NCEI.
|
Table 2. Top five driest years by total precipitation (in.). |
||||
|
Rank |
Arizona |
California |
||
|
1 |
1956 |
6.04 |
2013 |
7.93 |
|
2 |
2020 |
6.63 |
1976 |
11.75 |
|
3 |
2002 |
6.97 |
2020 |
11.97 |
|
4 |
1950 |
7.00 |
1898 |
12.47 |
|
5 |
2009 |
7.03 |
1947 |
13.17 |
|
1981-2010 |
12.58 |
23.12 |
||
Fig. 4. Plot of average statewide precipitation for Arizona (top) and California (bottom) for 1895-2020. Data source: NCEI.
|
Feature: Climate Change in the Southwest
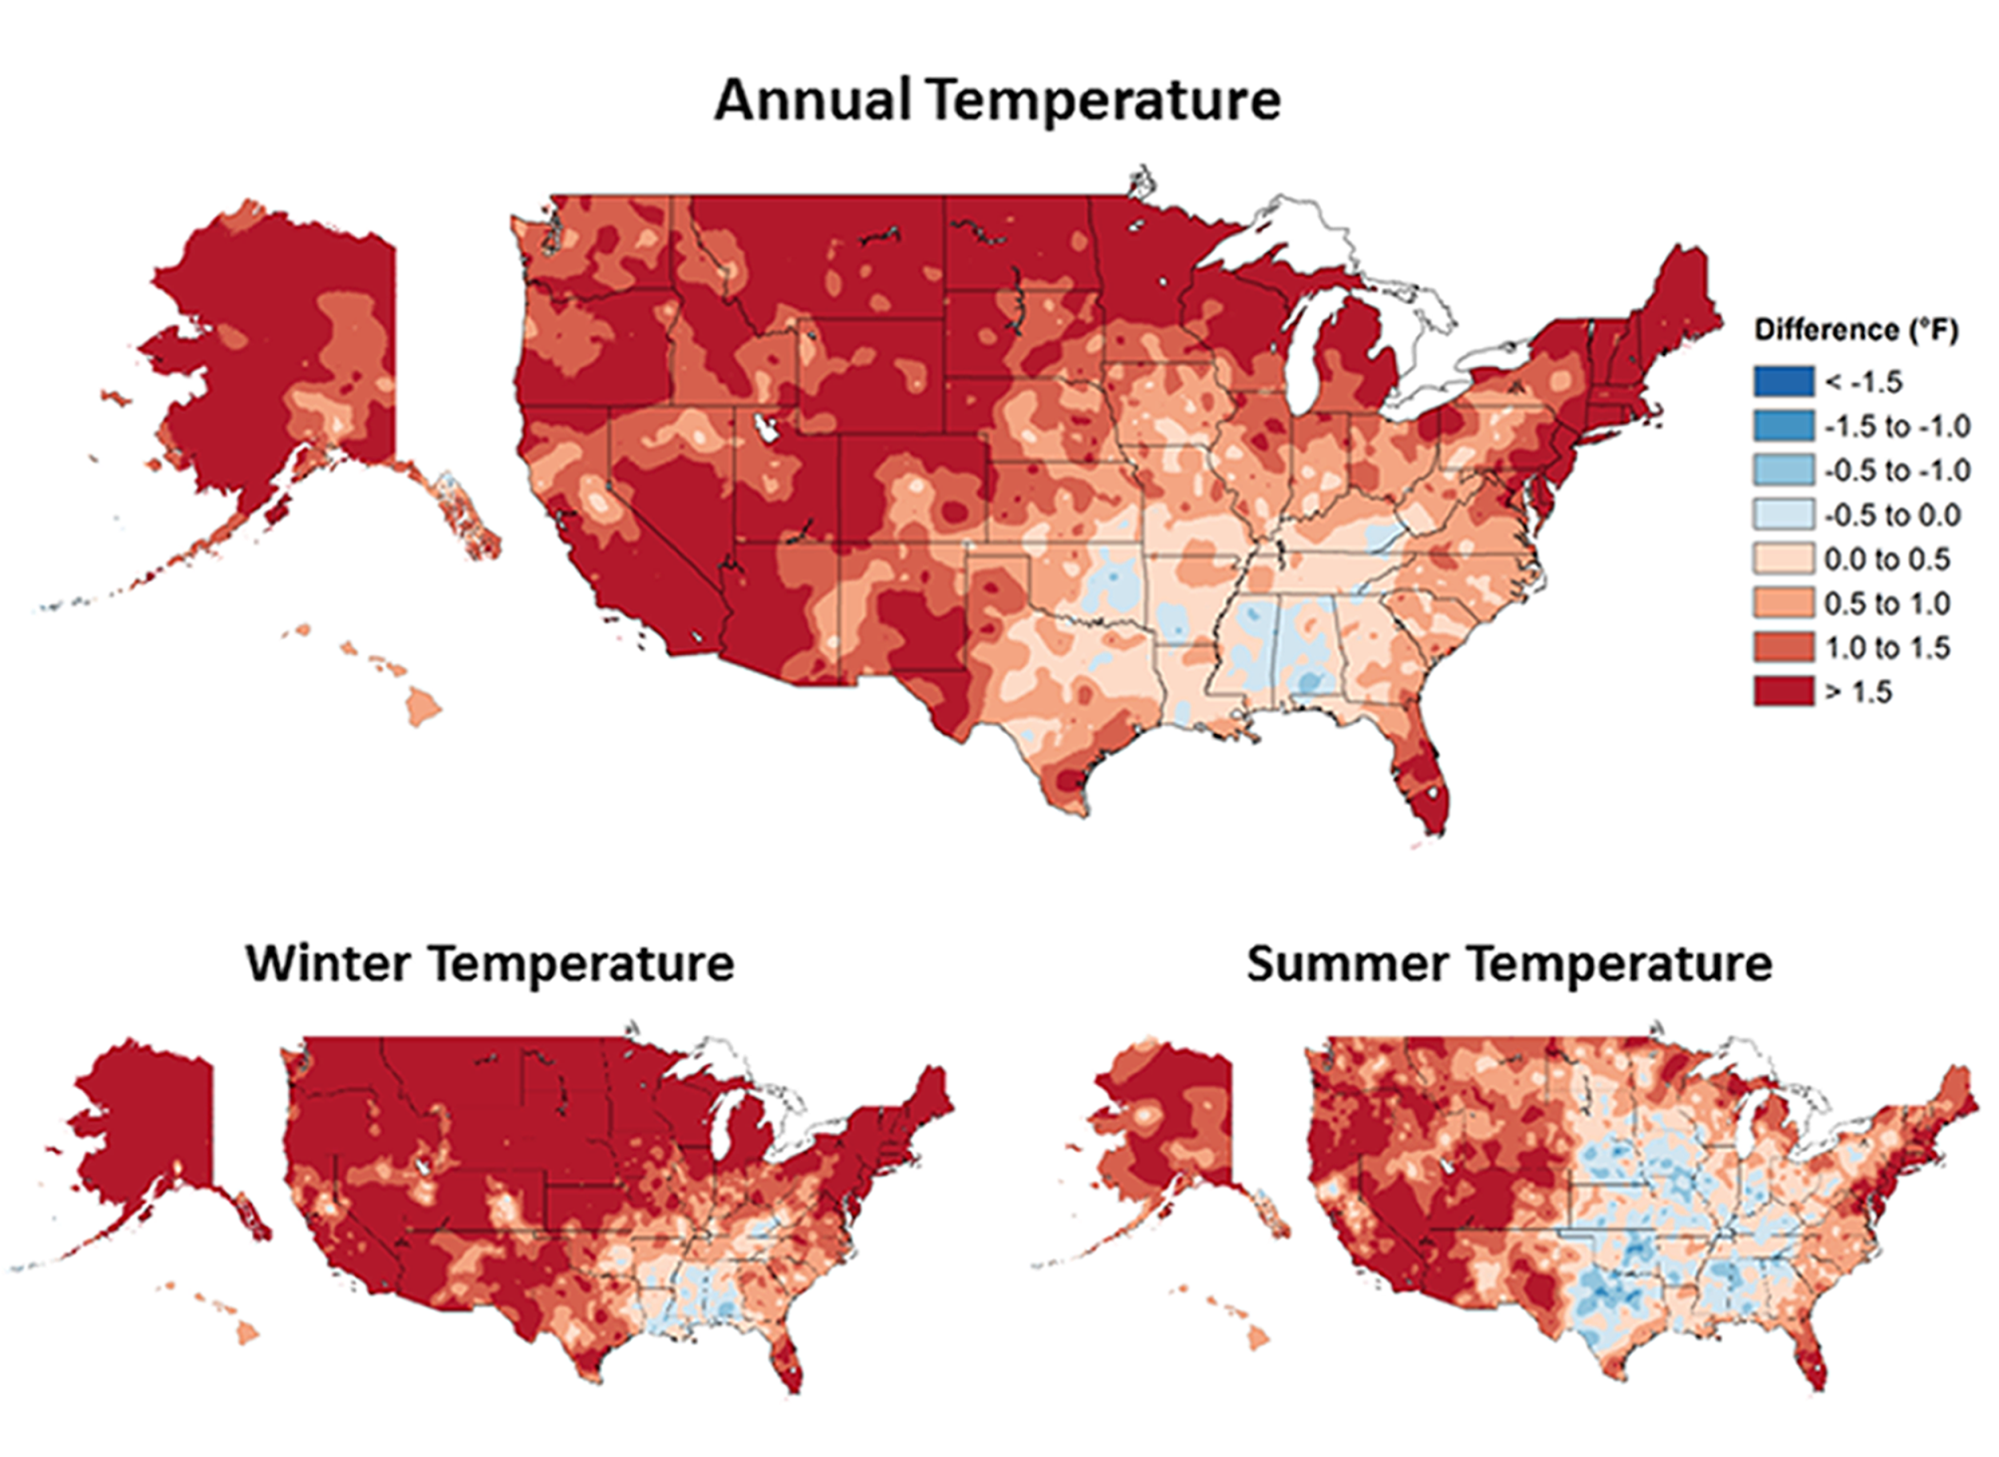
The Fourth National Climate Assessment (NCA4, 2017) provides details on how our climate is changing, driven in large part by human activity. The report notes “heatwaves have become more frequent in the United States since the 1960s, while extreme cold temperatures and cold waves are less frequent. Recent record-setting hot years are projected to become common in the near future for the United States, as annual average temperatures continue to rise.” The annual average temperature across the Southwest has increased by 1.6 °F (Figure 5). Increasing temperatures threaten society at large and in particular across the Southwest, impacting hydrologic cycles, ecosystems, and quality-of-life issues.
Fig. 5. From the NCA4, Figure 6.1. “Observed changes in annual, winter, and summer temperature (°F). Changes are the difference between the average for present-day (1986–2016) and the average for the first half of the last century (1901–1960 for the contiguous United States, 1925–1960 for Alaska and Hawai‘i). Estimates are derived from the nClimDiv dataset.” Data source: NOAA/NCEI.
Projections of future climates are based on “representative concentration pathways” (RCPs), which are various scenarios used to estimate the magnitude of potential warming due to increasing amounts of greenhouse gases in the atmosphere. RCP scenarios are used in climate models to project potential future climate states. The primary source of climate model projection data is the Climate Model Intercomparison Project (CMIP), which “promote[s] a new set of coordinated climate model experiments”. The latest version, CMIP5, provides data for end users to study potential future impacts of various climate scenarios.
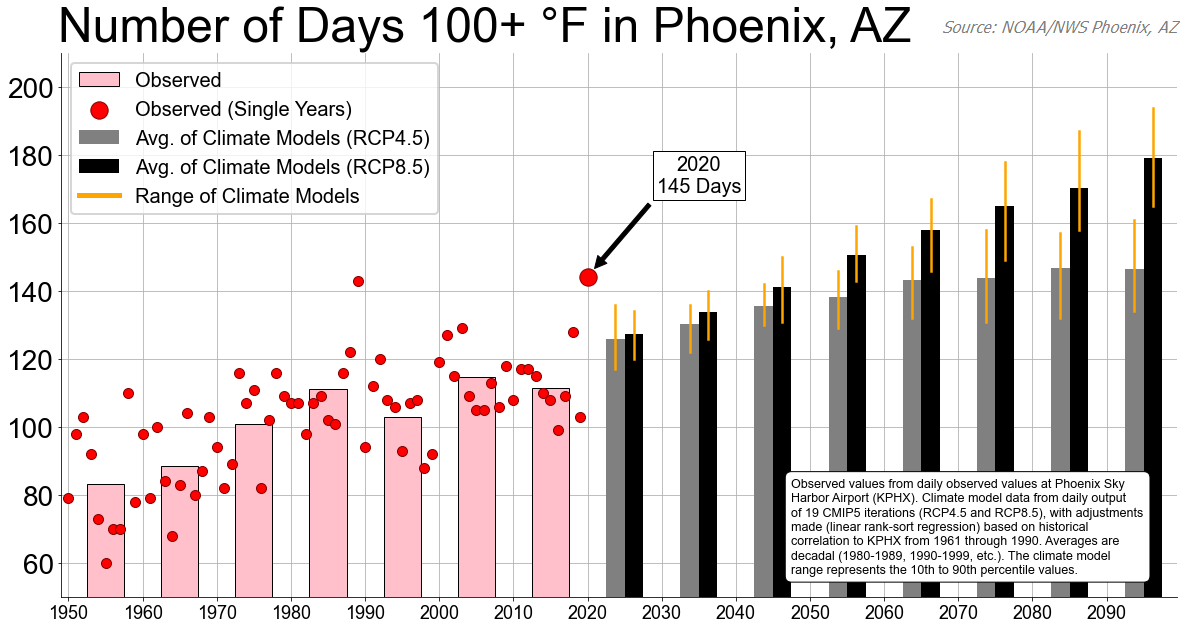
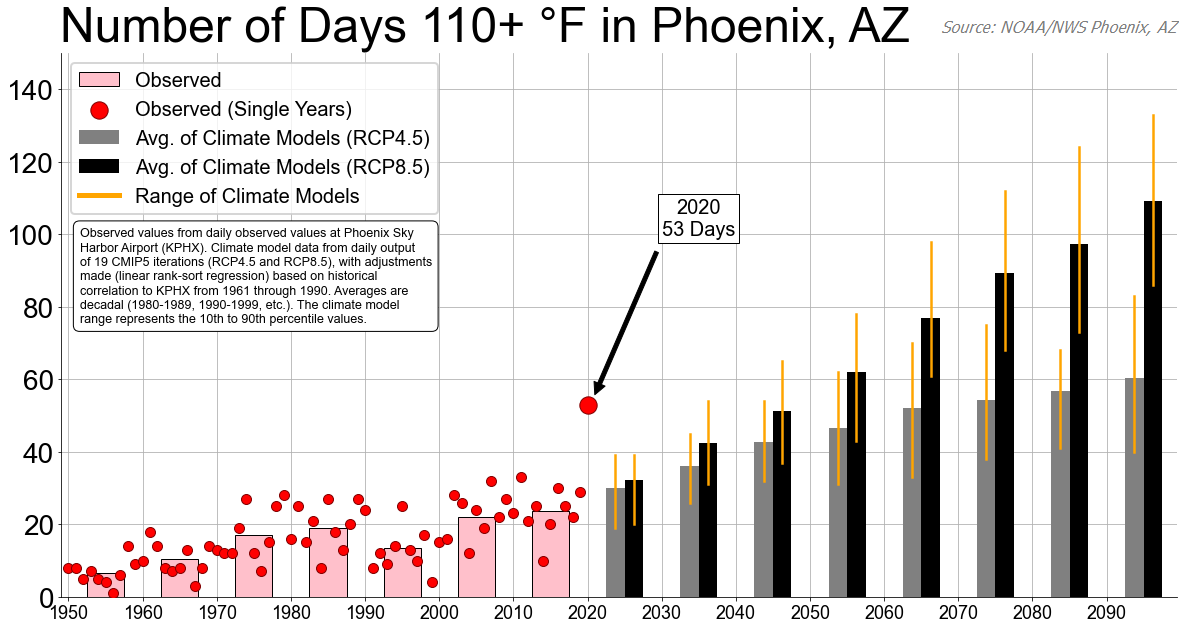
During 2020, Phoenix, AZ set a new record for most days in a year with a high temperature at-or-above 100 °F (110 °F) at 145 (53). To put this into a long-term context, temperature data from nineteen CMIP5 model members were obtained for Phoenix, AZ, using RCP scenarios 4.5 (low emission scenario) and 8.5 (high emission). Historical model forecast data were obtained back to 1950, with projected data obtained to 2100. For each member, historical data were bias-corrected to official observed data for Phoenix using a rank-sort method, with those corrections applied to projected data (Figures 6, 7).
Fig. 6. The number of days in a year with high temperatures in Phoenix, AZ at-or-above 100 °F. Red dots represent the number of days by year as observed at the NWS official climate station for Phoenix, whereas pink bars represent the given decadal average. Note that 2020 set a new record at 145 days, eclipsing the previous record of 143 days in 1989. The gray (black) bars represent the decadal average number of days with high temperatures at-or-above 100 °F in Phoenix, AZ from nineteen CMIP5 climate model projections for the low emission scenario RCP4.5 (high emission scenario RCP8.5). Vertical orange lines represent the 10th to 90th percentile range of values.
Fig. 7. Same as Figure X except for 110 °F.
The results show that the severity of temperatures experienced during 2020 are projected to be common within 20-40 years. Put another way, 2020 was a preview of what a typical summer in Phoenix, AZ will be like in 20-40 years. Climate projections become increasingly severe as the end of the century approaches. |
Annual Records
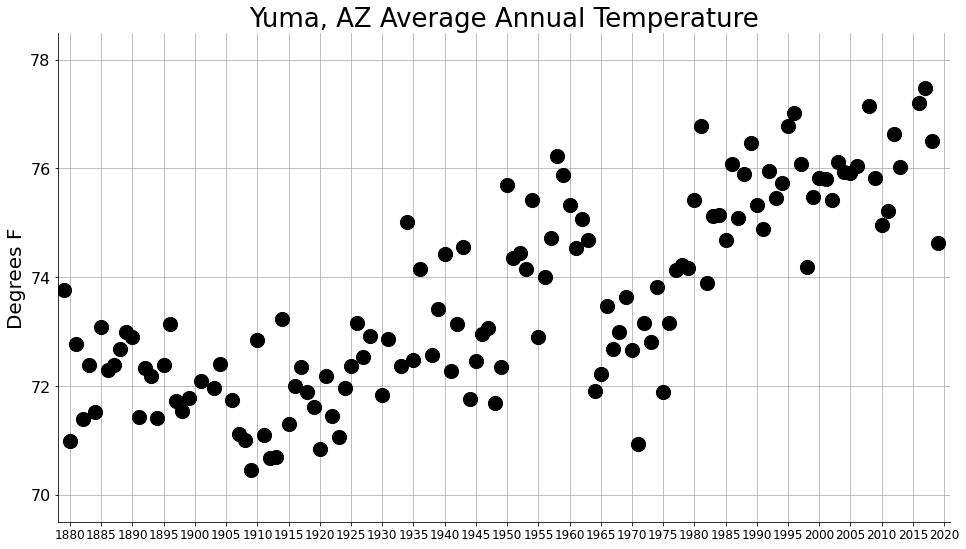
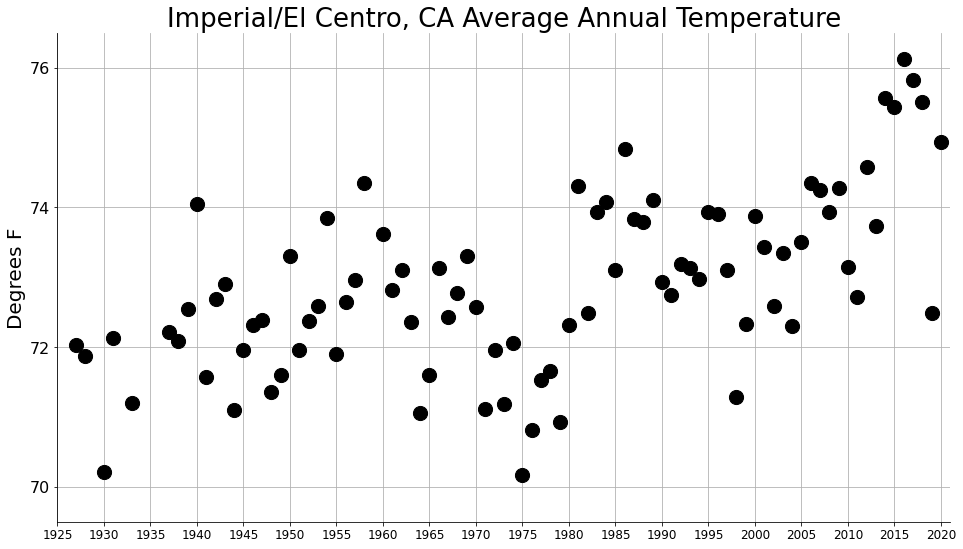
While 2020 exhibited record heat at times, overall it was not the hottest year on record for any individual state in the Southwest or for any individual local long-term climate station. For Phoenix, it was the second hottest year on record with an average temperature of 77.2 °F (record remains 77.3 °F). For Imperial/El Centro, CA it was the (tied) 6th warmest year on record. Due to excessive missing data, an annual ranking could not be calculated for Yuma, AZ. Additional metrics can be found here. Figure 8 displays the annual values for the three locations - all of which exhibit an upward trend during recent decades.
|
|
|
|
|
Fig. 8. Historical average annual temperature for Phoenix, AZ (left), Yuma, AZ (center), and Imperial/El Centro, CA (right). At 77.2 °F, 2020 was the second hottest on record (behind 77.3 °F in 2017). |
||
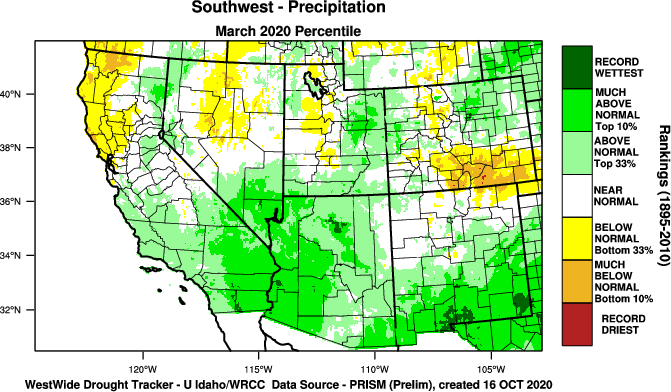
Monthly Records
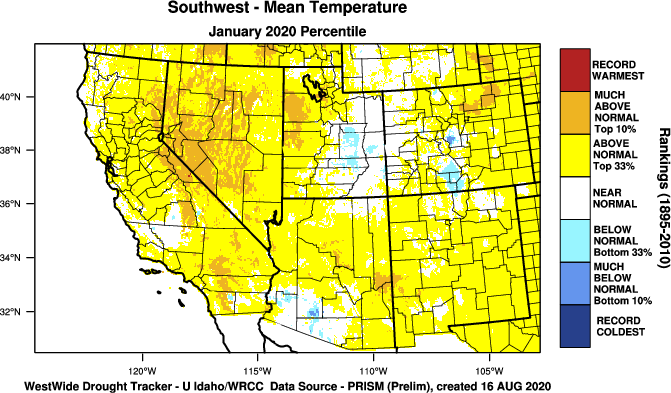
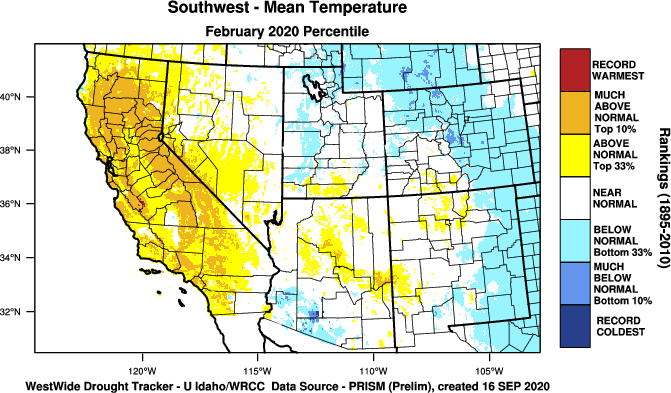
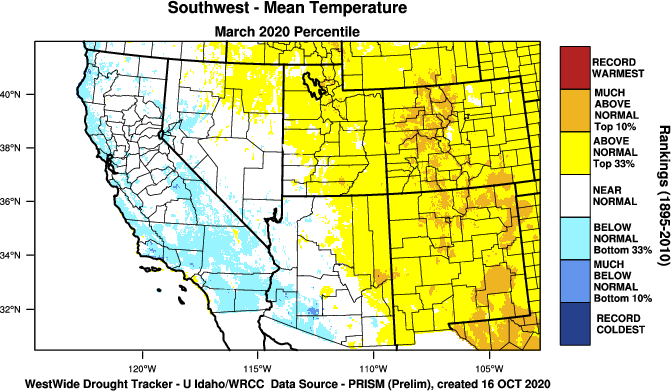
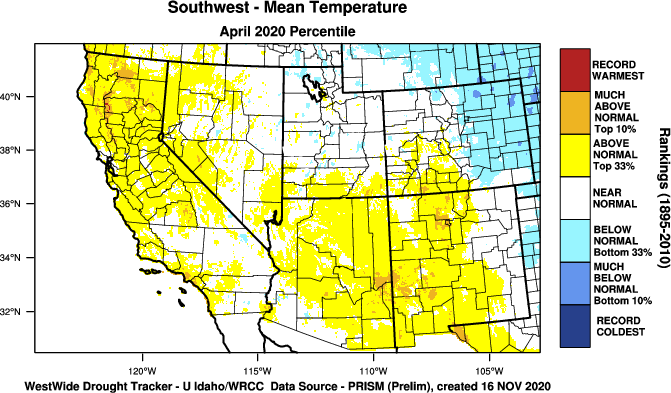
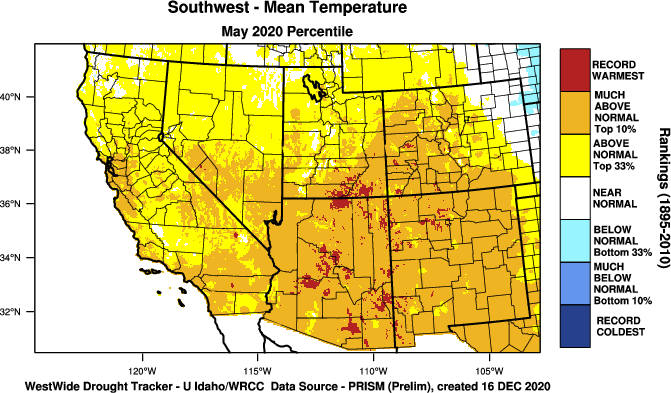
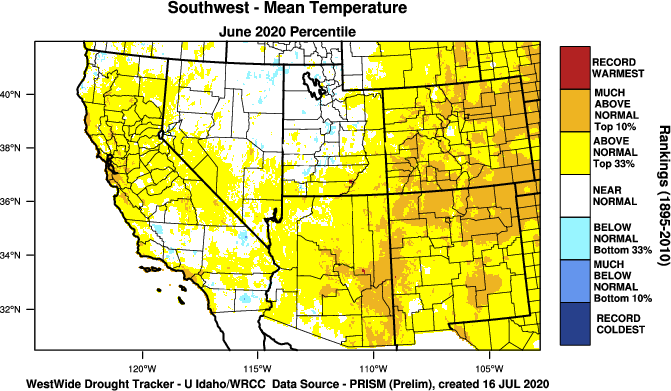
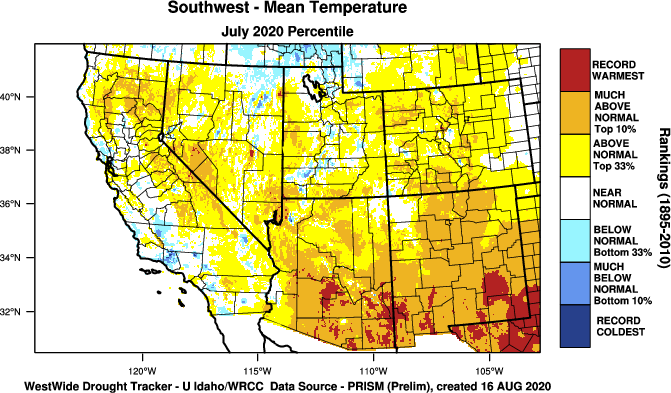
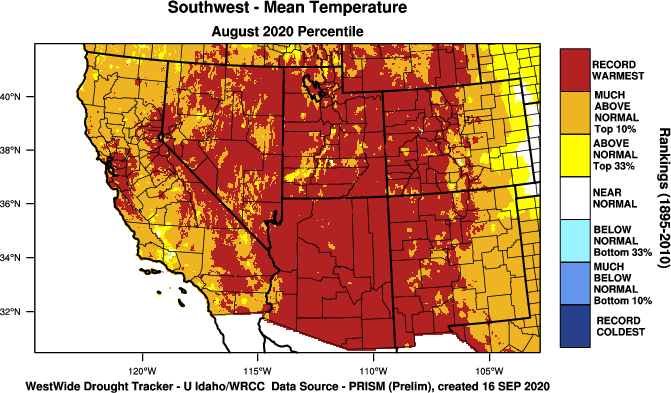
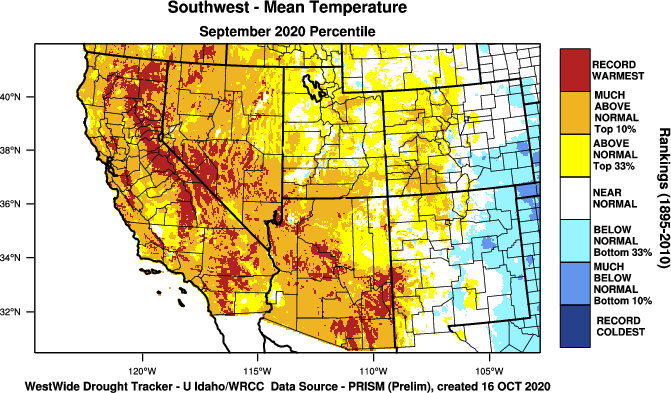
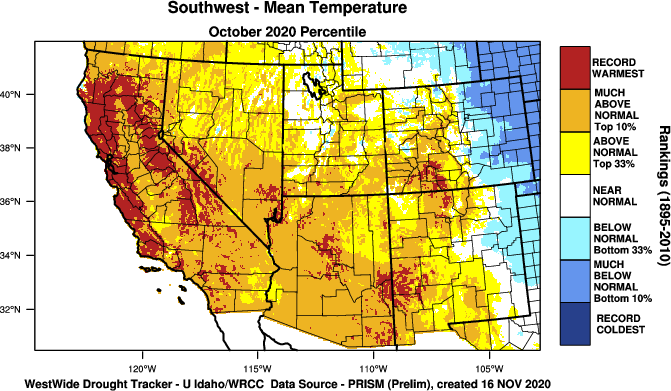
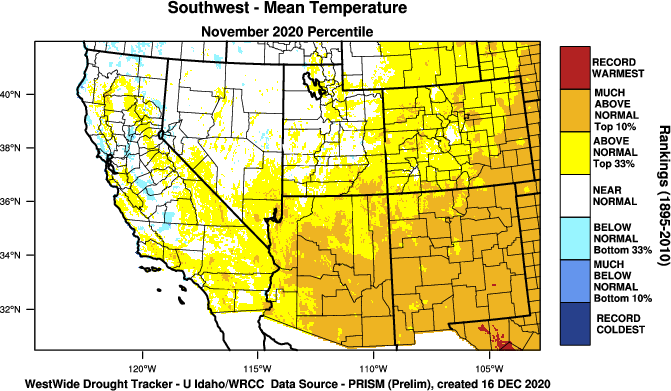
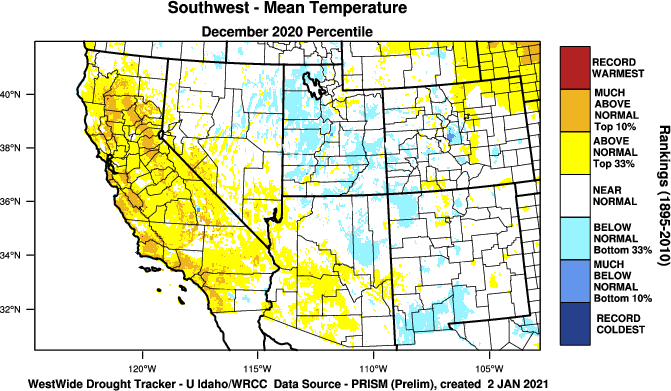
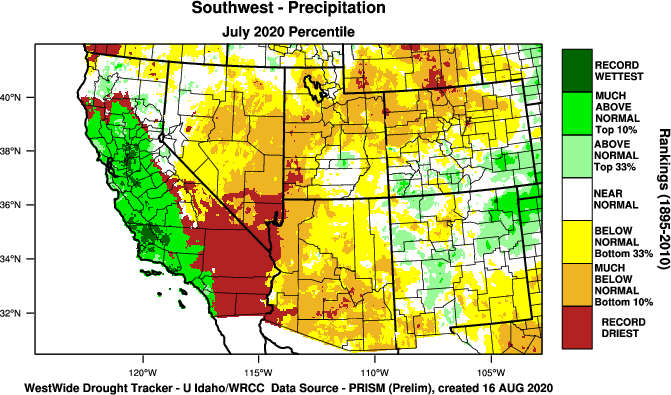
While 2020 was relatively cool for the first few months of the year, the spring became quite warm followed by a record-setting summer (FIgure 9). Phoenix set a new record for hottest month ever, with an average temperature of 98.9 °F during July 2020. The record stood for one month, as it was eclipsed by August 2020 with an average temperature of 99.1 °F. Yuma and Imperial/El Centro set no new monthly temperature records through the year.
|
|
|
|
|
|
|
|
|
|
|
|
|
|
|
|
|
Fig. 9. Average temperature percentiles by month across the Southwest. Data source: WestWide Drought Tracker/PRISM. |
||
|
|
|
|
|
|
|
|
|
|
|
|
|
|
|
|
|
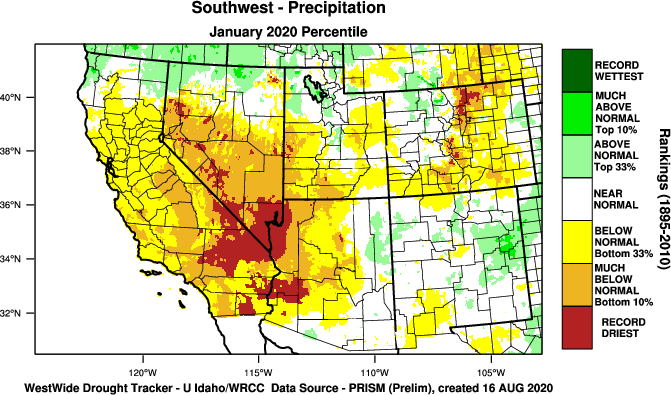
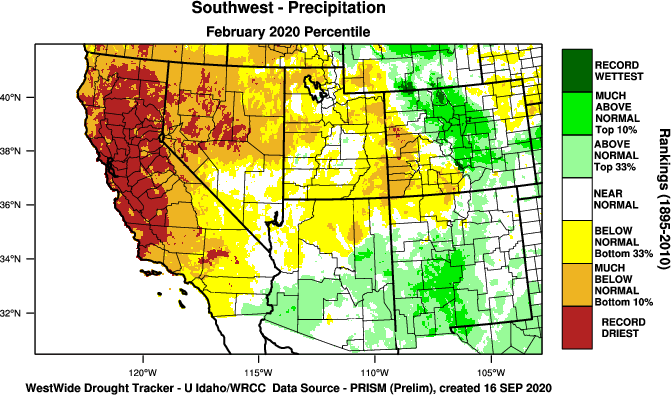
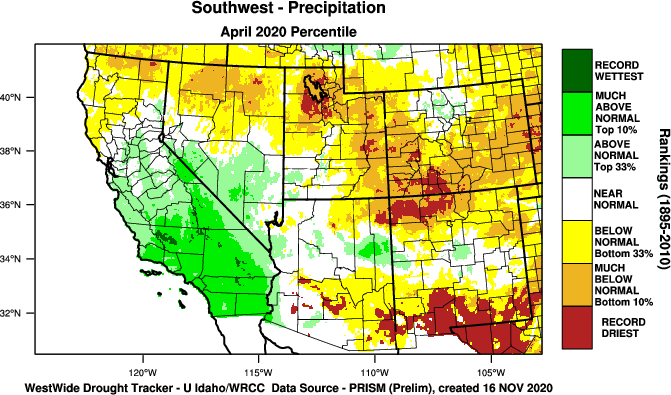
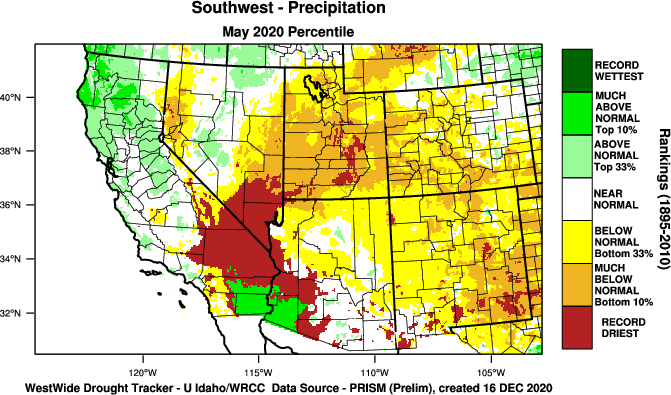
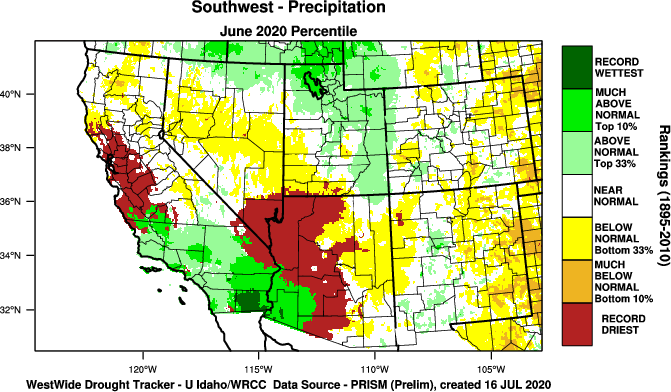
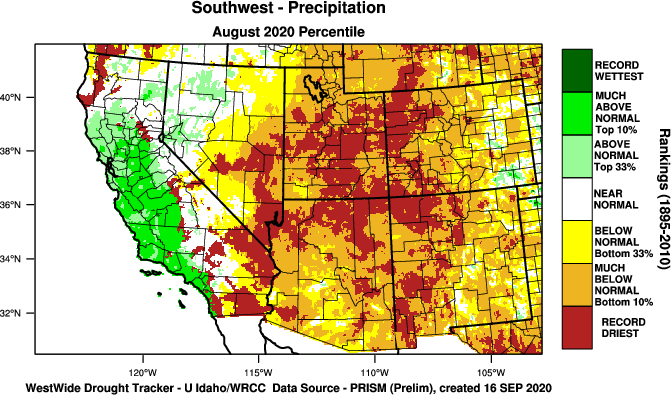
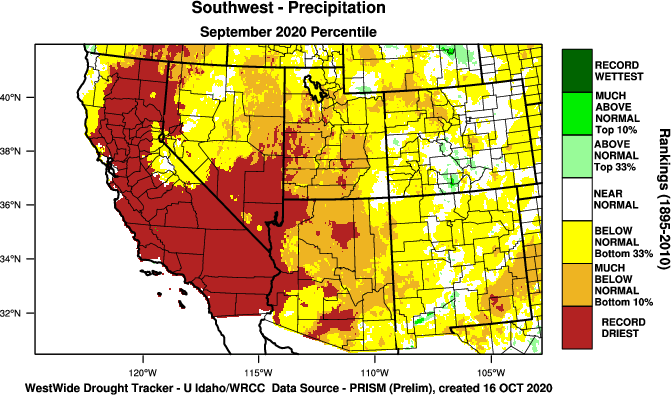
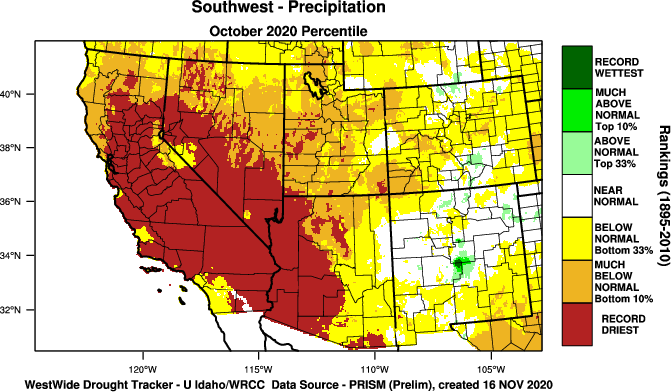
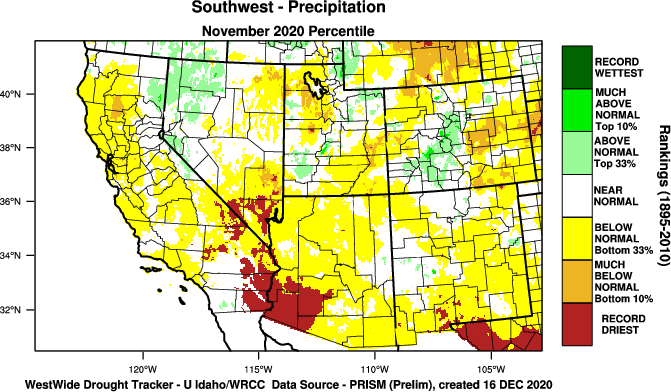
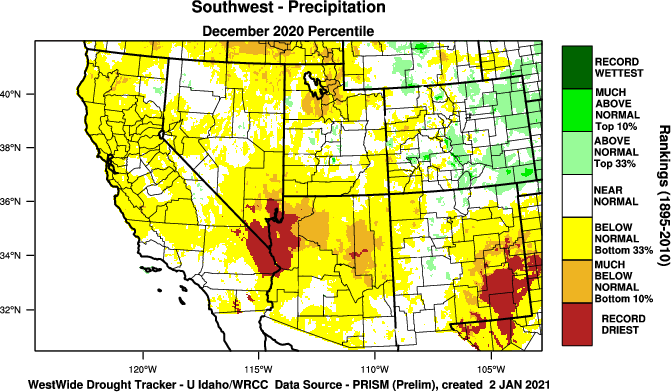
Fig. 10. Precipitation percentiles by month across the Southwest. Data source: WestWide Drought Tracker/PRISM. |
||
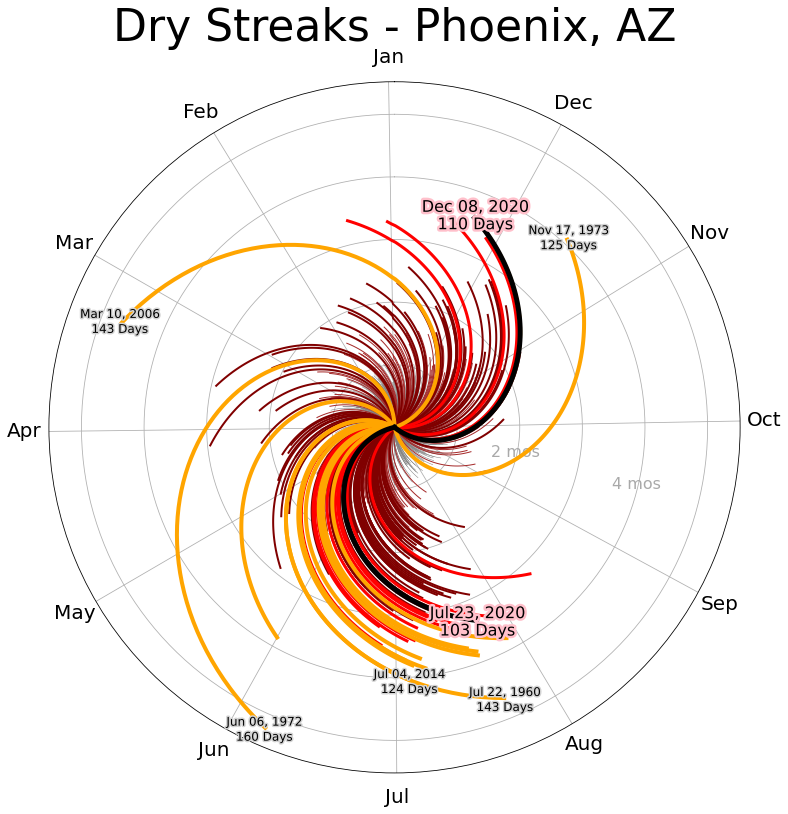
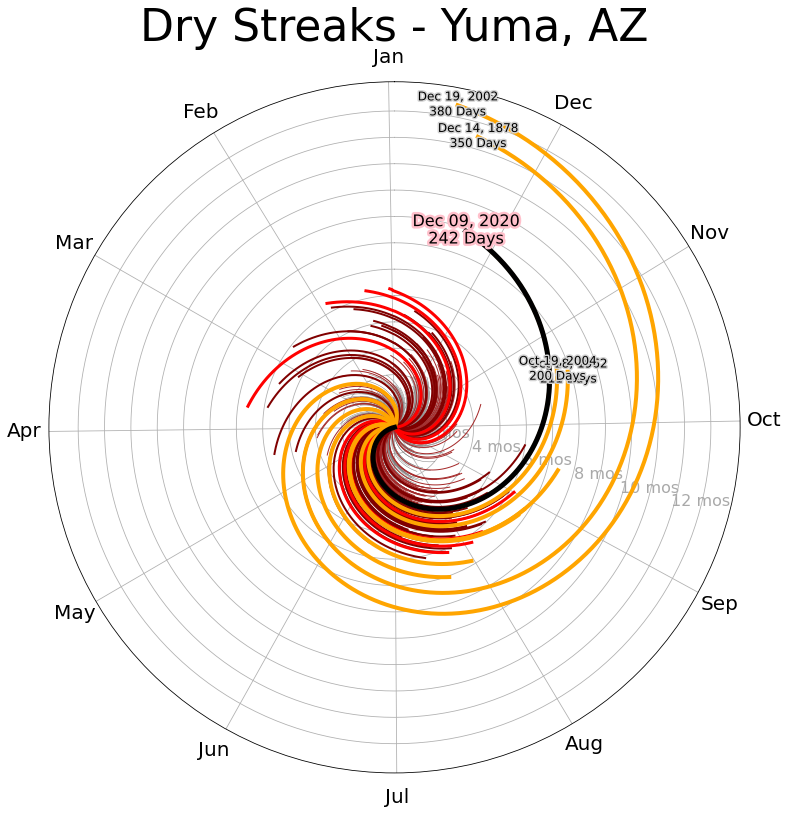
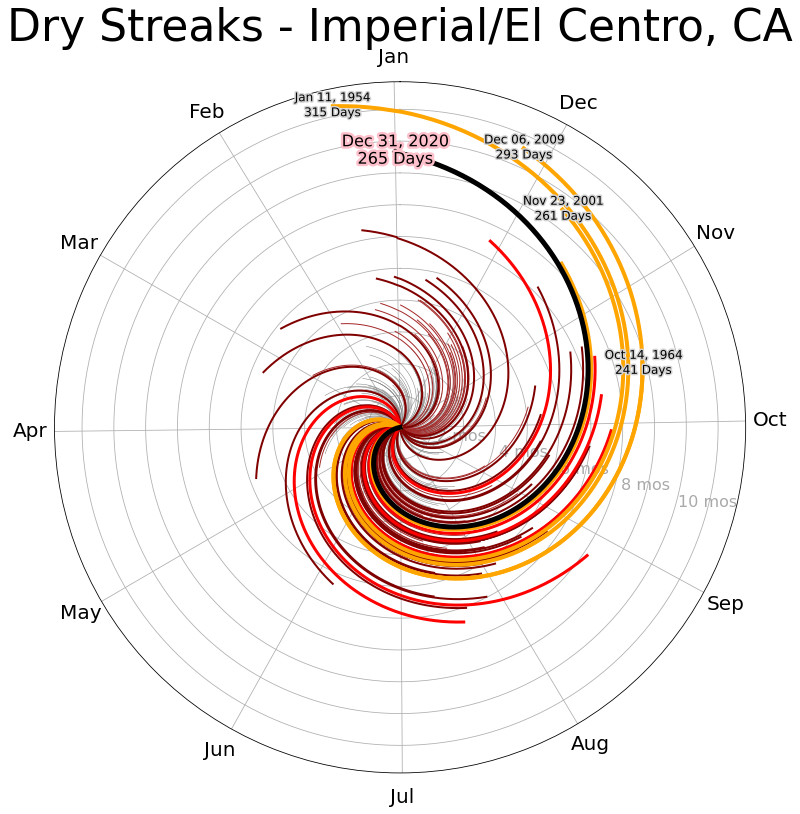
No months were the wettest on record (Figure 10). Several months tied as driest on record (September, October, and November in Phoenix; May through November in Yuma; May through December in Imperial/El Centro). Full numbers are available here. While some of these months are notably very dry from a climatological perspective, it is unusual to have such extended dry stretches. In fact, Phoenix itself observed two separate instances with 100+ consecutive days with no rain - 103 days ending July 23 (22nd longest on record) and 110 days ending December 8 (15th longest). Yuma saw an incredible 242 consecutive days with no rain end on December 9 (3rd longest). Imperial/El Centro ended the year in the midst of a 265 day dry streak (3rd longest). The shown “spiral” charts (Figure 11) depict the nature of dry streaks at these three locations.
|
|
|
|
|
Fig. 11. Spiral charts representing dry streaks at three local long-term climate stations. The distance from the center outward (length) represents duration while the position on the circle (angle) represents the time of year. The longest five dry streaks are labeled and any more than 100 days in 2020. |
||
|
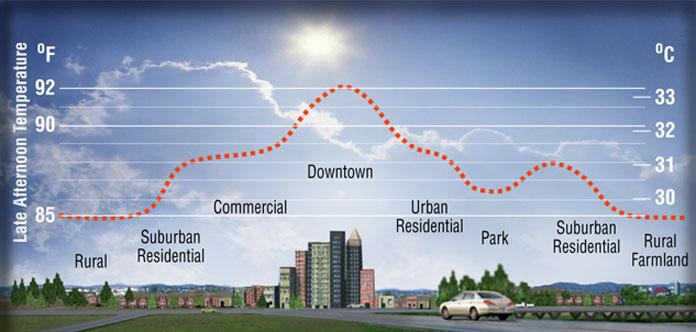
Feature: The Urban Heat Island
Image Source: Berkeley Lab Heat Island Group
The mechanisms which lead to the creation of an urban heat island (UHI) have been studied since the 18th century. All communities, regardless of size, generate an excess amount of heat through human activities and alterations to the built environment as compared to the surrounding or previously pristine conditions (Figure 12). As communities grow in size and population, the impacts also increase. This extra energy can impact the local climate in many ways, one of which is an increase in the air temperature. In general, daytime temperatures in urban areas are found to be slightly higher compared to the surrounding rural areas (with suburban location in between). This can be complicated in arid environments, as the added activity of irrigation of greenspaces within communities can cause humidity values to be higher than surrounding desert areas and more humid air requires more energy to warm than drier air. At night, the physical properties of the urban/suburban built environment (buildings, roads, parking lots, etc.) cause stored energy from the sun to be released much more slowly than the surrounding rural/undeveloped areas. The result is warmer nighttime temperatures within communities than the surrounding areas. For arid climates, the effect can be much more pronounced as dry desert air more readily cools at night. A cyclical effect can also develop, where abnormally warm overnight temperatures allow a “head start” for the next day.
Fig. 13. Satellite imagery of the Phoenix, AZ area in 1984 and 2016. Source: Google Earth
As early as 1921, urban effects on the local climate in Phoenix, Arizona were recognized. Analyzing winter-time minimum temperatures in the Salt River Valley, Gordon (1921) found that the weather station in Phoenix was warmer than expected for a low-valley location. He noted that the “Riverside Nursery is protected on the north by both the diversion of the cold air stream and by the city of Phoenix itself with its warming influence”, likely making him the first scientist to describe the Phoenix UHI. Since that time, the population has increased nearly 50-fold (1920 population of ~0.1M, 2019 population ~5.0M), resulting in an intensification and expansion of the UHI (Figure 13).
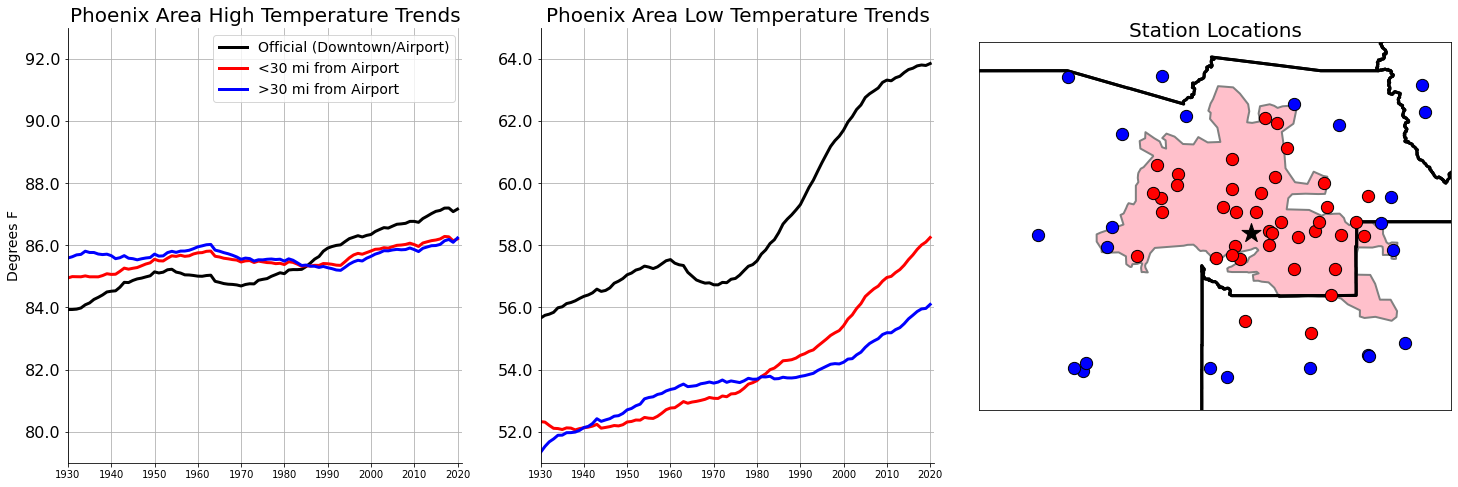
An analysis was completed comparing the long-term temperature records at the official Phoenix, AZ station (downtown from 1895 through 1953, then at Sky Harbor Airport) and surrounding stations. The surrounding stations were averaged into two groups - those within 30 miles of the official station (current location) and those more than 30 miles (Figure 14, right panel). Data for the three groups were then averaged by month/year and a rolling 30-year window was then applied (a standard time frame to consider for climatological purposes).
Fig. 14. High (right) and low (center) temperature analysis at the official record station for Phoenix, AZ (black), a group of urban stations (red), and a group of suburban/rural stations (blue). Current urban area shown as pink shading/gray outline. Station locations indicated on the right-panel map, color coded by group. High temperature trends between the three groups are similar for the past several decades (1991-2020) at 0.3-0.4 °F/decade. Low temperature trends at the official station (1.5 °F/decade) are similar to the urban group (1.3 °F/decade) and notably higher than the suburban/rural group (0.8 °F/decade), which is a change from earlier in the 20th century when trends were similar between all three.
For high temperatures, there has been a steady increase over the years (1991-2020) at the official station (urban core; Figure 14, left panel, black) of 0.4 °F/decade while the urban (red) and suburban/rural (blue) stations have warmed at 0.3 °F/decade. For low temperatures, the difference is more significant. Over the same 1991-2020 period, the official station has warmed 1.5 °F/decade (Figure 14, center panel, black) compared to 1.3 °F/decade at the urban stations (red) and 0.8 °F/decade at the suburban/rural stations (blue). It is evident that the rate of warming has accelerated in the past several decades at the urban stations though is showing some signs of leveling at the official station. |
Daily Records
Many climate stations with long-term records set an abnormally high number of daily records in 2020. Specific daily records for Phoenix, AZ, Yuma, AZ, and Imperial/El Centro, CA are available here.
Theoretically with a sufficiently long station history and given no trends in the regional/local climate, each year would roughly have set the same number of daily records, with variations only due to weather and sub-seasonal fluctuations. This expectation is not generally observed in reality, as nearly all climate stations across the region are experiencing long-term warming. Therefore, there is a trend for more warm records to be set in recent (warmer) years compared to earlier (cooler years). In addition, some stations are observing urban heat island (UHI) warming trends superimposed on the regional warming, causing a large amount of warm daily records to be attributed to the more recent hot years. This was especially true in 2020, where long-term climate trends combined with the hot sub-seasonal weather conditions (and in some locations the added UHI signal) to produce a record number of daily temperature records.
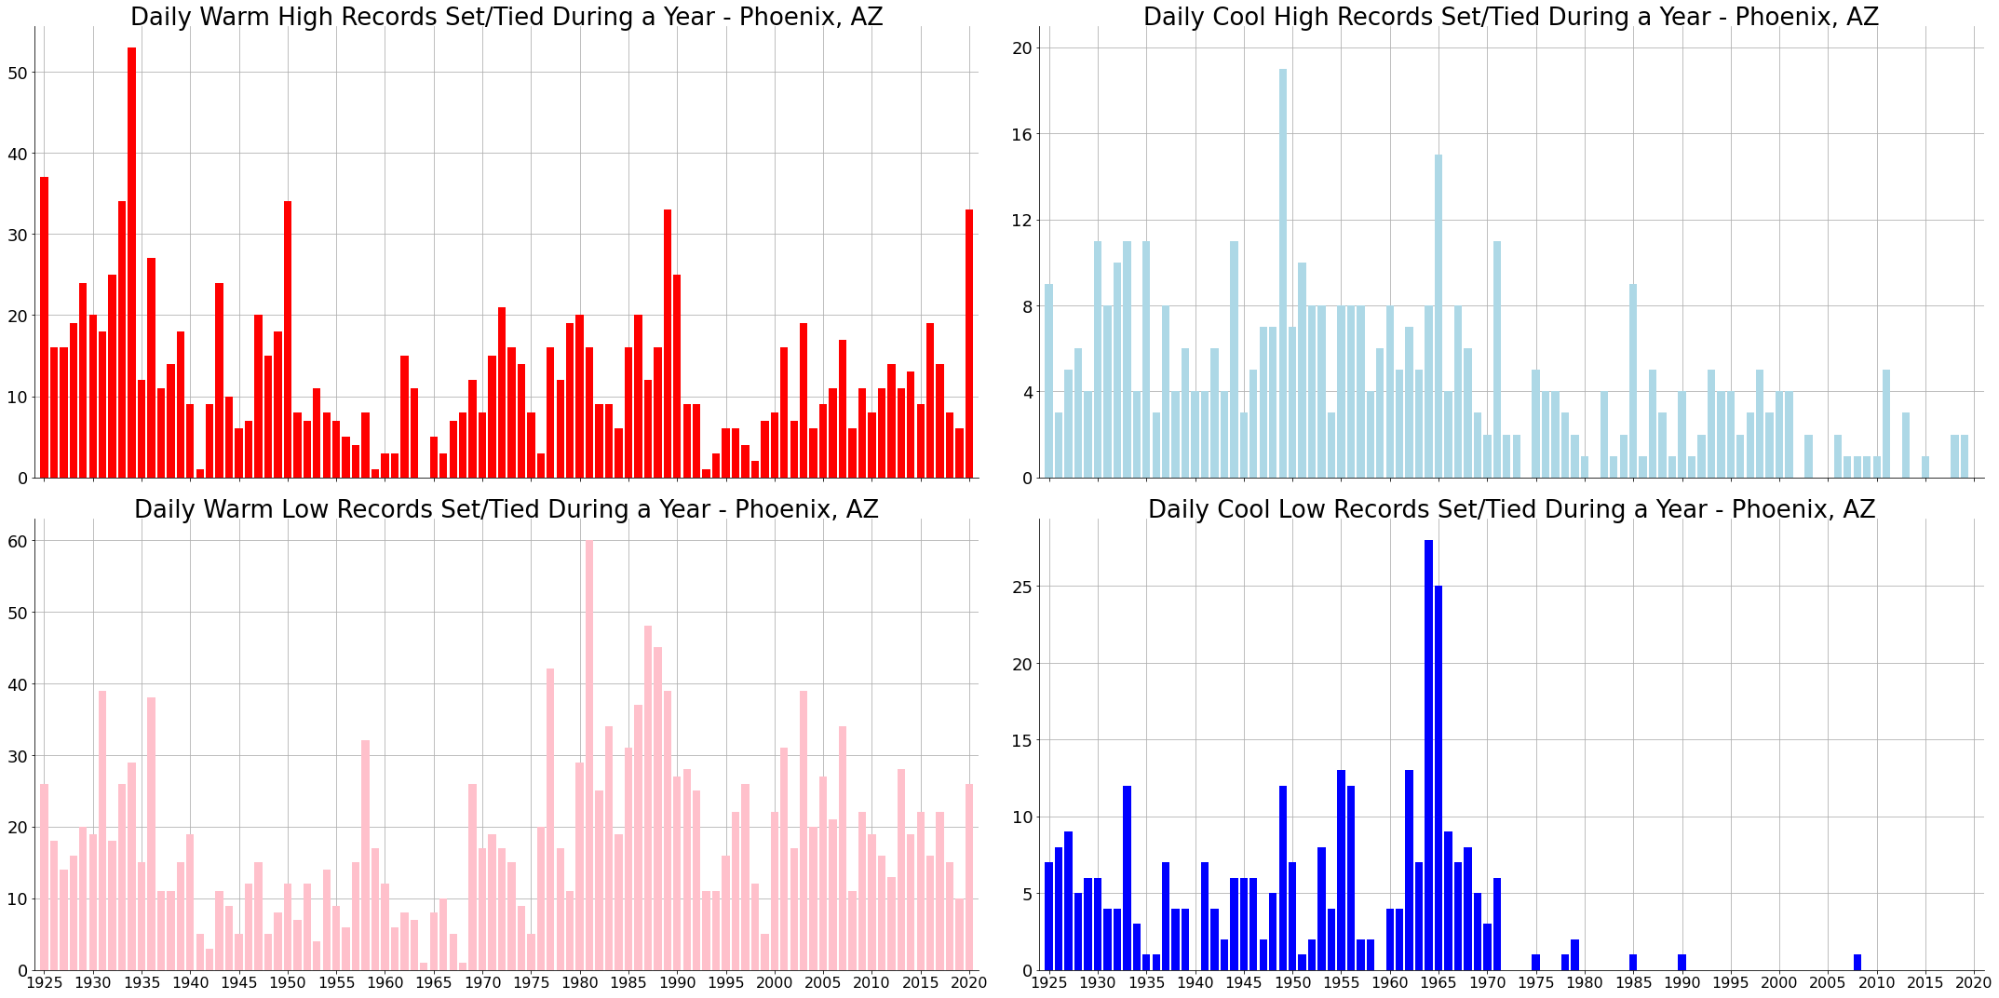
Fig. 15. Daily temperature records set during each year in Phoenix, AZ. Values are determined
by considering the period of record up to the plotted year. For example, the number of
records set in 1980 would be compared to the years 1895-1979.
In 2020, Phoenix, AZ set or tied the record for warm high temperature on 33 days, which was the most in a given year since 1989 (also 33) and fifth most overall. The greatest number on record remains the 54 days from 1934 (Figure 15). For warm low temperatures, the record was set or tied on 26 days, which was the most since 2013 (28 days). The greatest on record remains 60 days in 1981. Data for Phoenix are available since 1895.
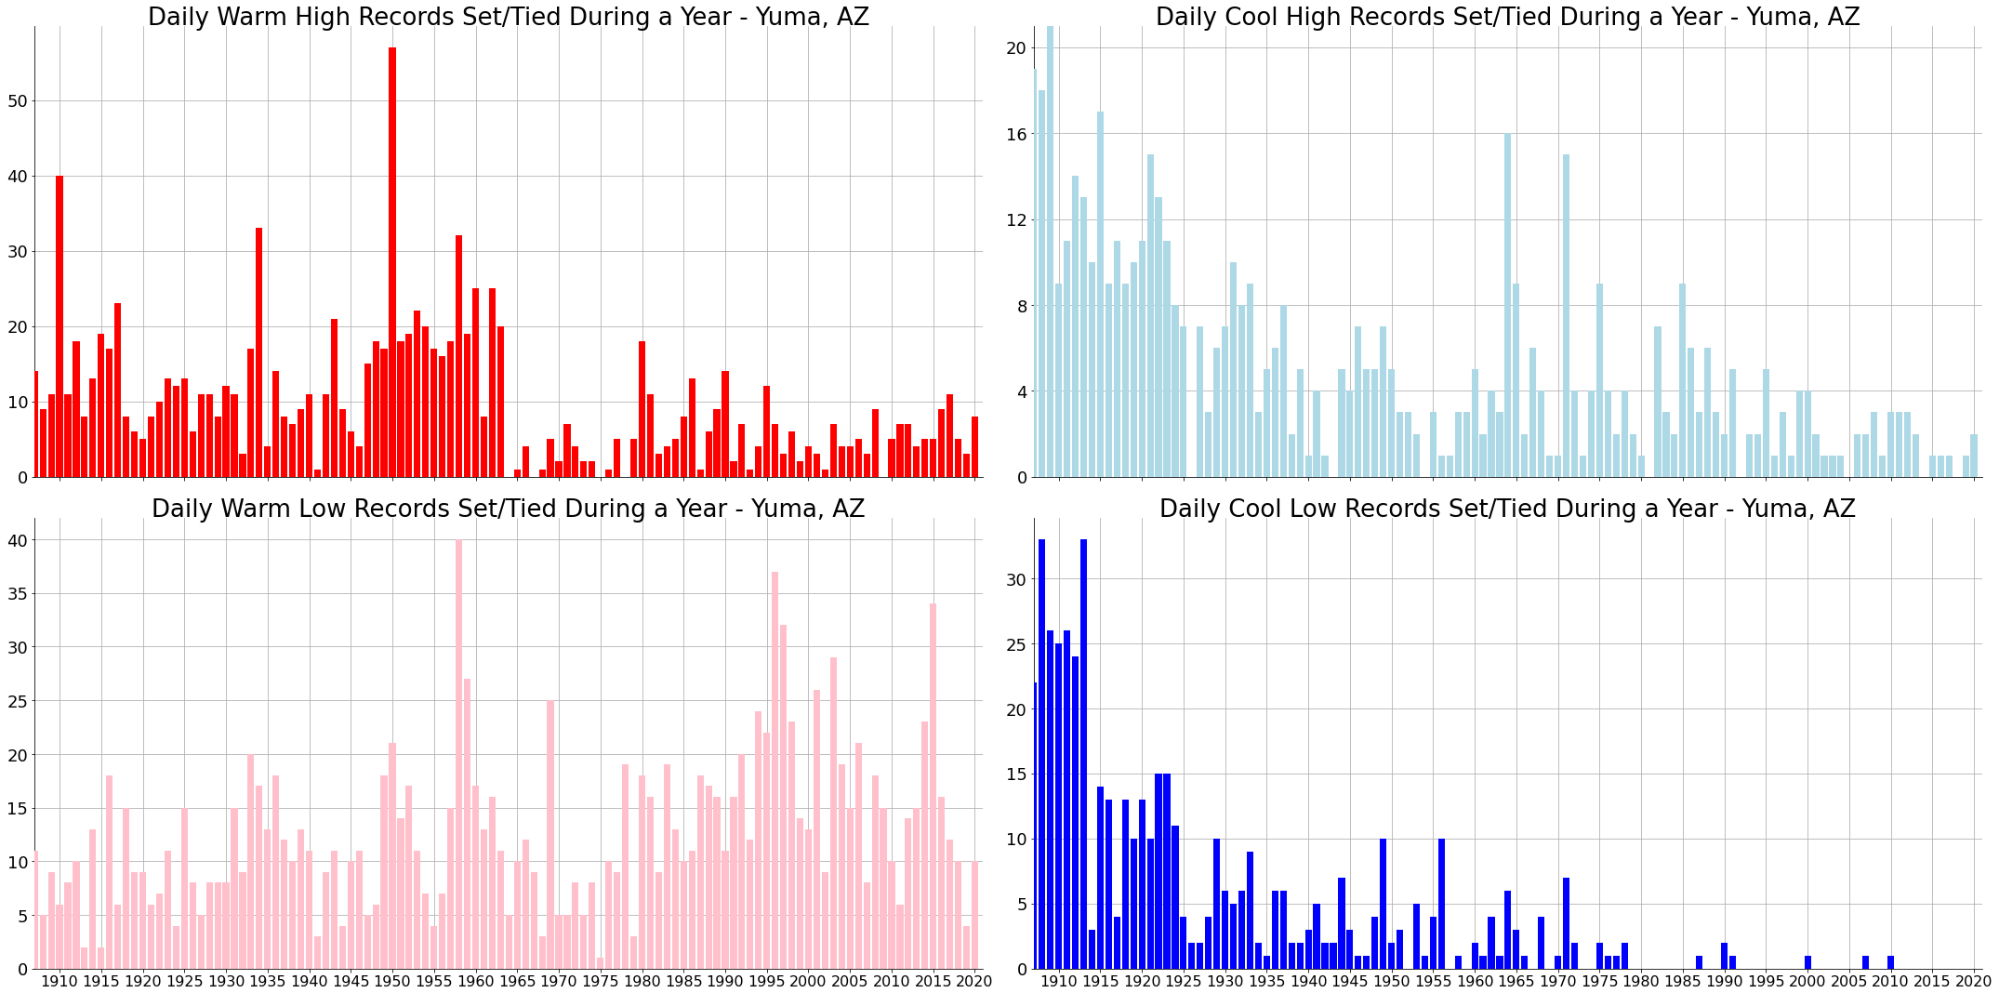
Fig. 16. Similar to Figure X but for Yuma, AZ.
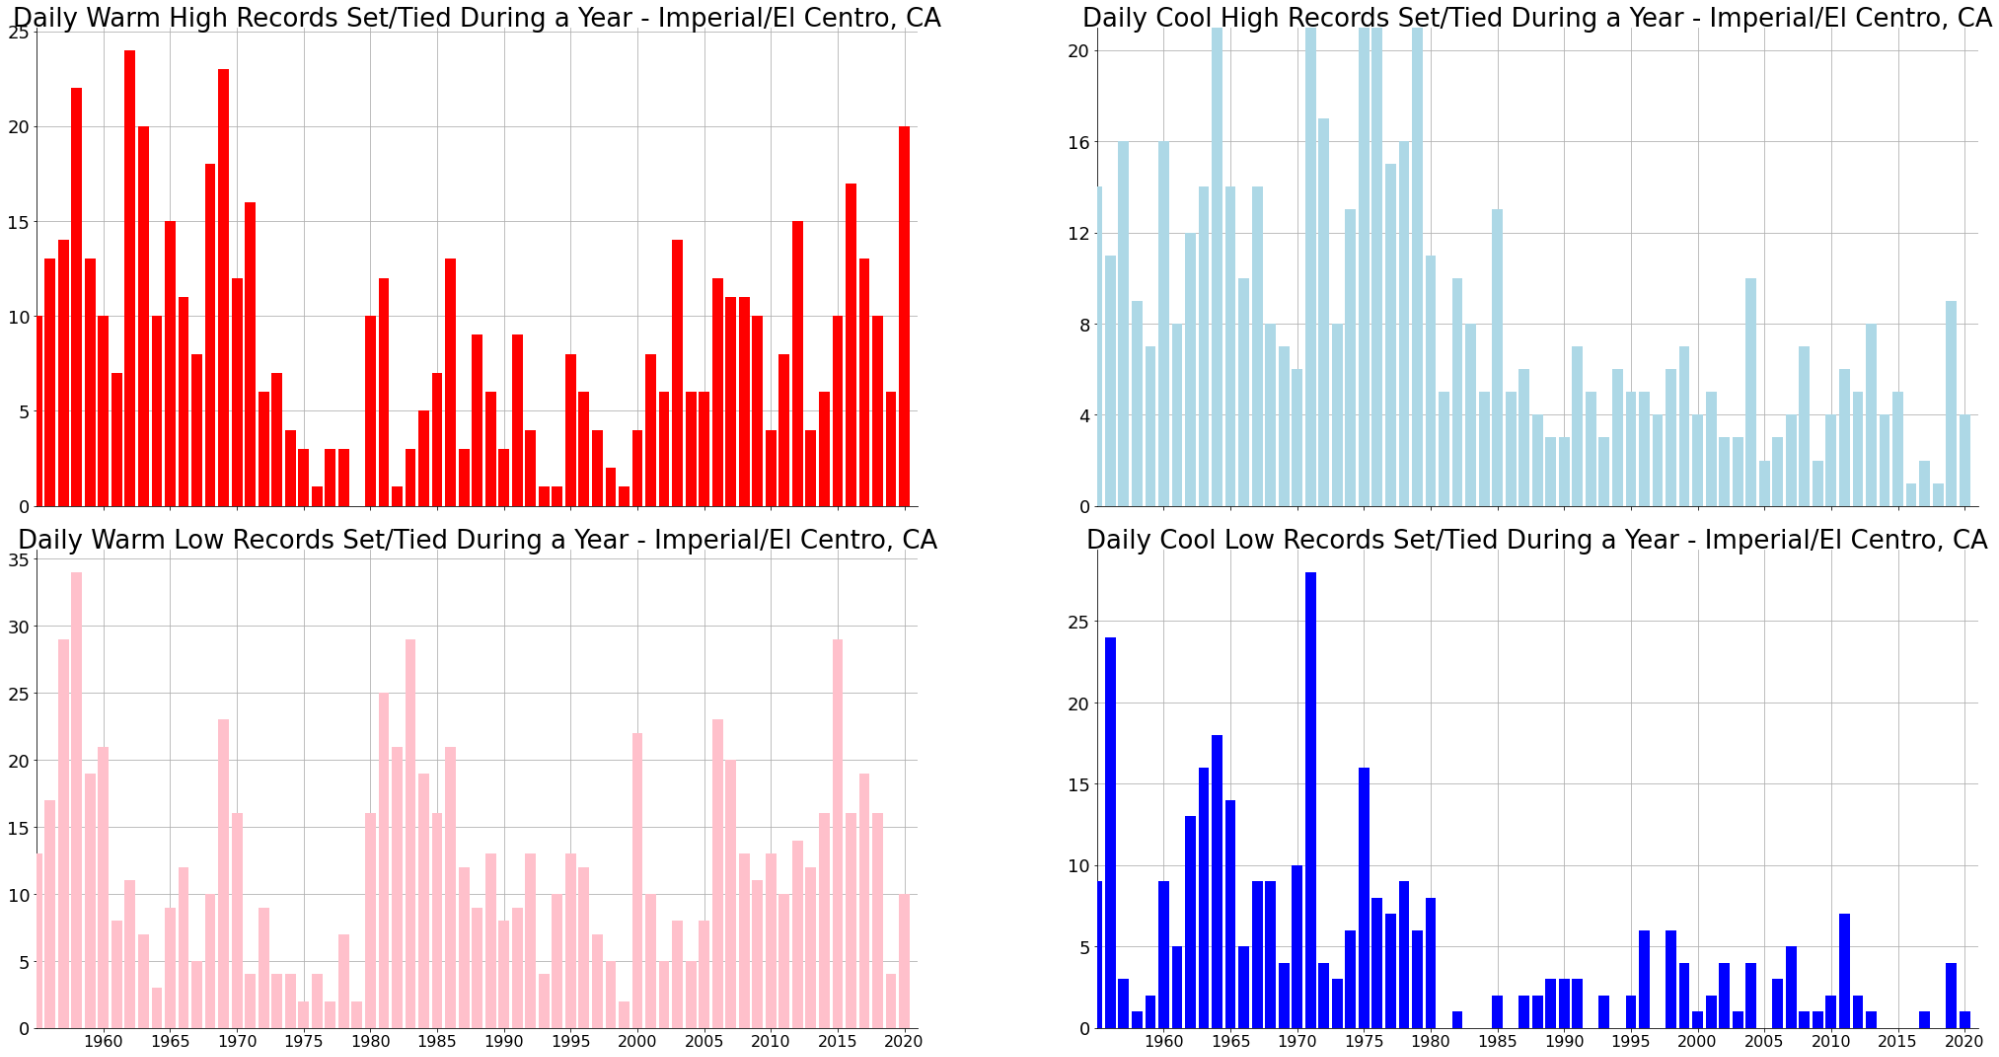
In Yuma, AZ, 8 record warm high temperatures were set in 2020 (most remains 57 in 1950) and 10 record warm low temperatures (most remains 40 in 1958). Data for the Yuma area are available since 1878 (Figure 16). In Imperial/El Centro, CA, 20 record warm high temperatures were set in 2020 (most remains 24 in 1962) and 10 record warm low temperatures (most remains 34 in 1958). Data for the Imperial/El Centro area are available since 1925 (Figure 17).
Fig. 17. Similar to Figure X but for Imperial/El Centro, CA.
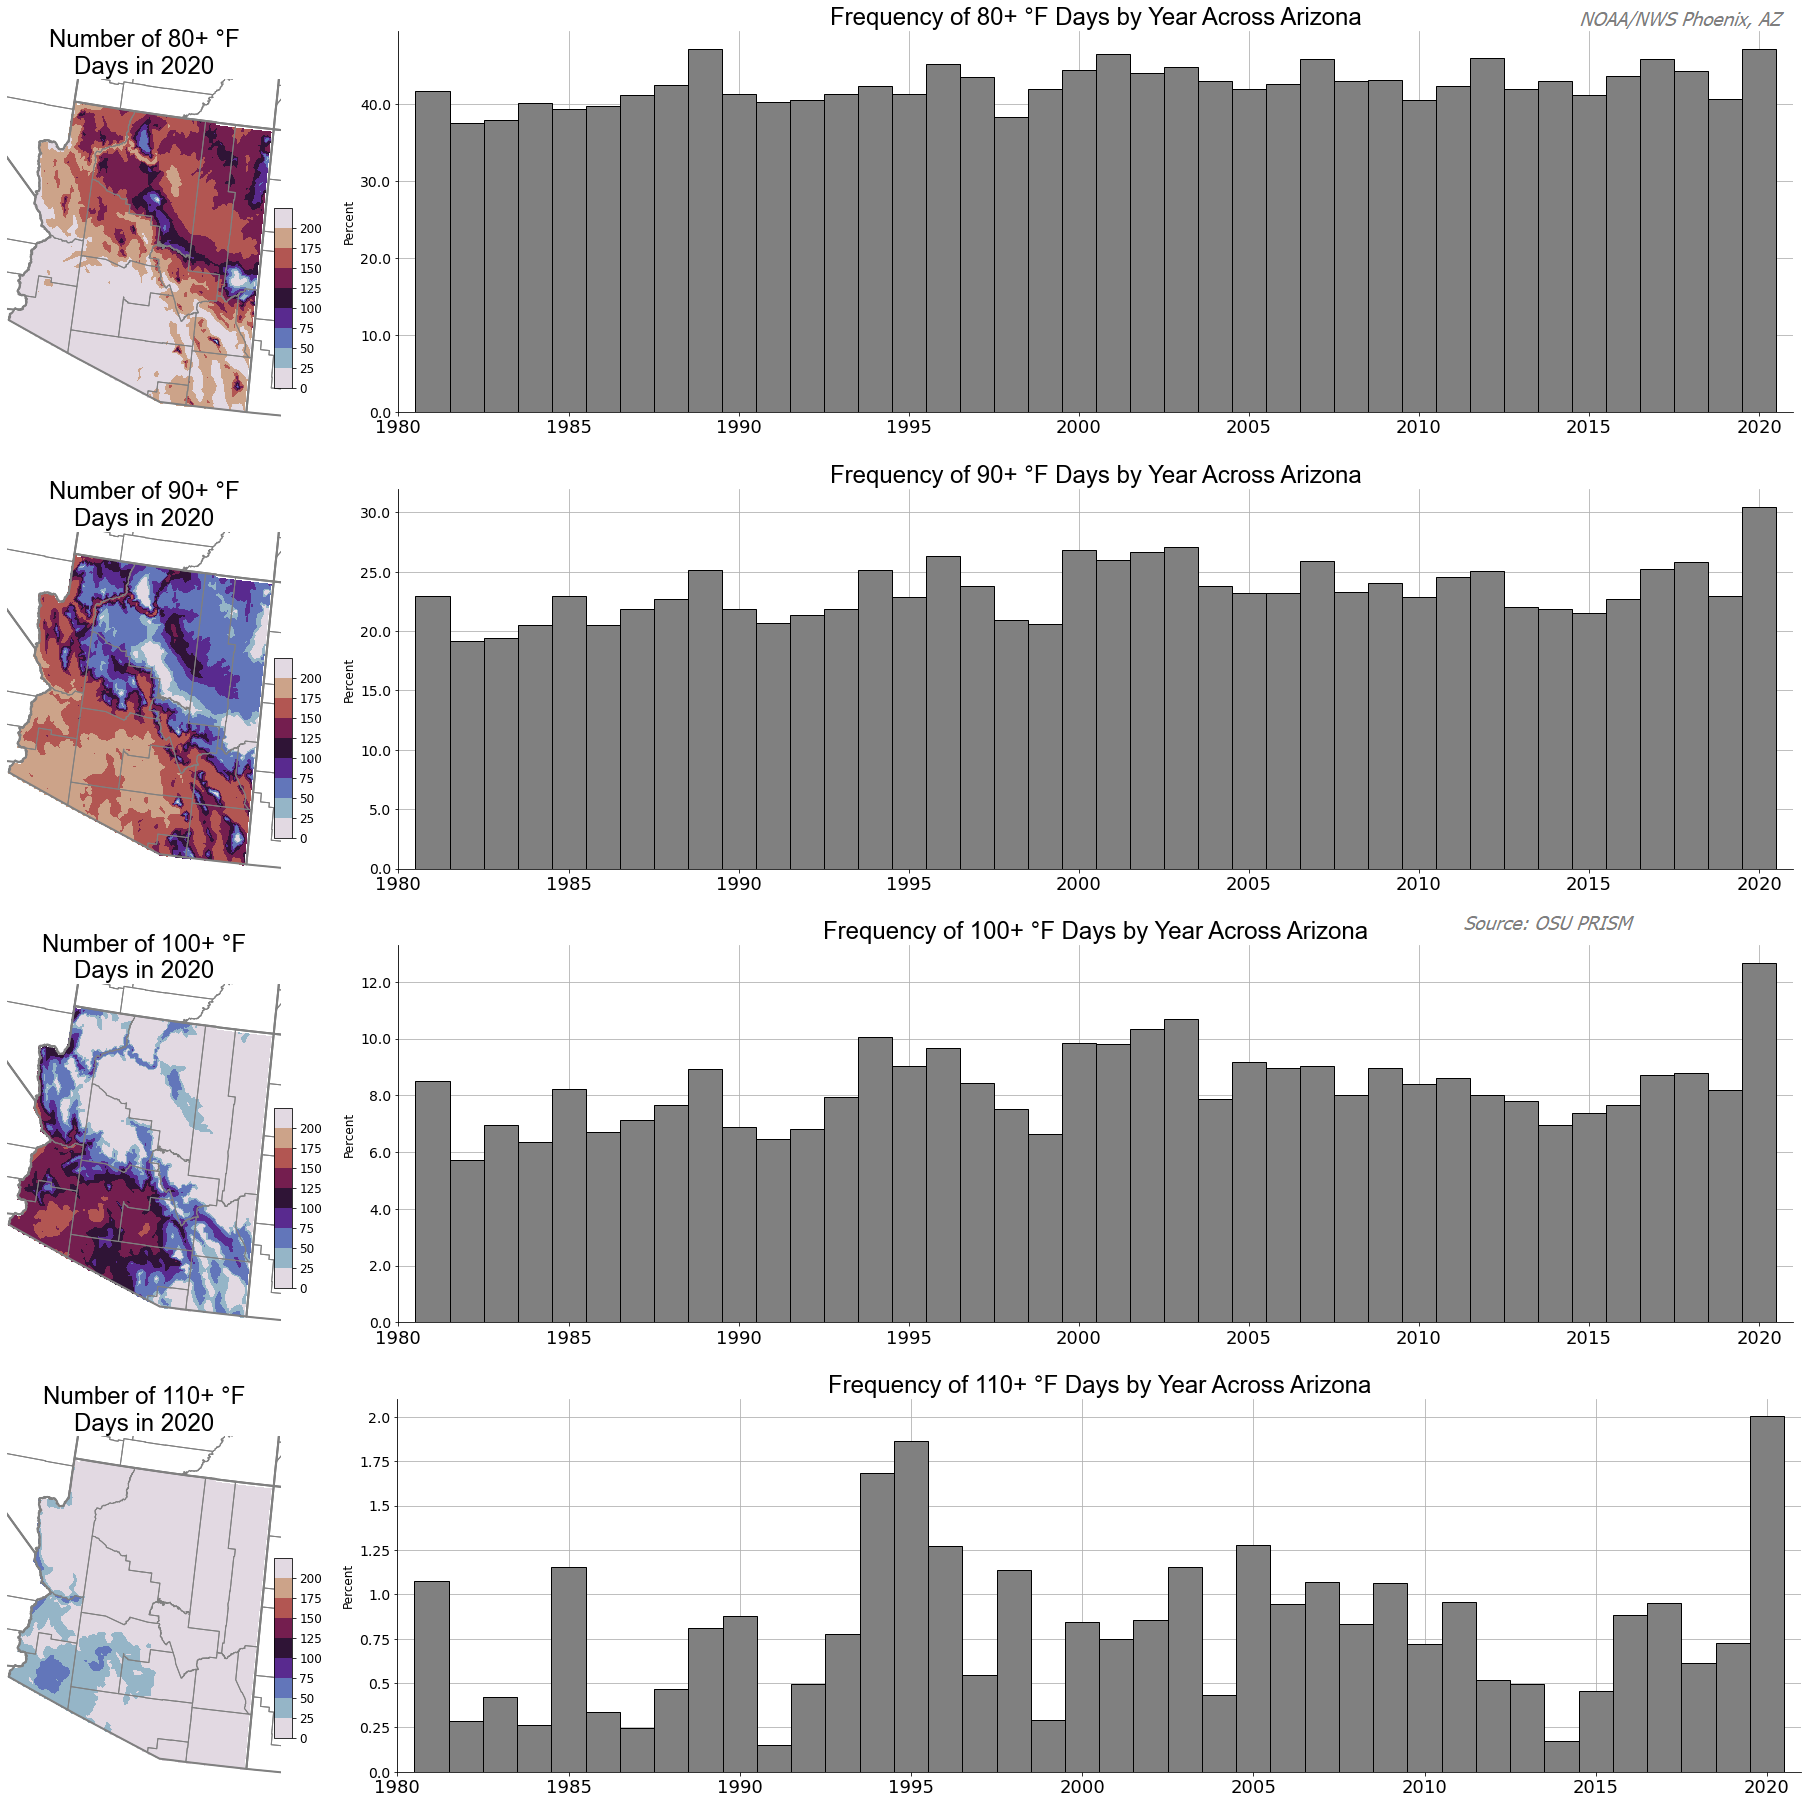
Based on daily gridded data (source: OSU PRISM), 2020 saw the highest frequency of maximum temperatures above 90, 100, and 110 °F across Arizona since 1980 (Figure 18). The frequency of 80+ °F maximum temperatures in 2020 (47.08%) was just below that in 1989 (47.09%). The value in 2020 for 90+ °F was 30.4% (previous high 27.1% in 2003), 12.7% for 100+ °F (previous high 10.7% in 2003), and 2.0% for 110+ °F (previous 1.9% in 1995).
Fig. 18. (Left column) Number of days in 2020 with maximum temperatures at-or-above
80/90/100/110 °F across Arizona. (Right column) Annual frequency of maximum temperatures
at-or-above 80/90/100/110 °F averaged across Arizona since 1981. Data source: OSU PRISM.
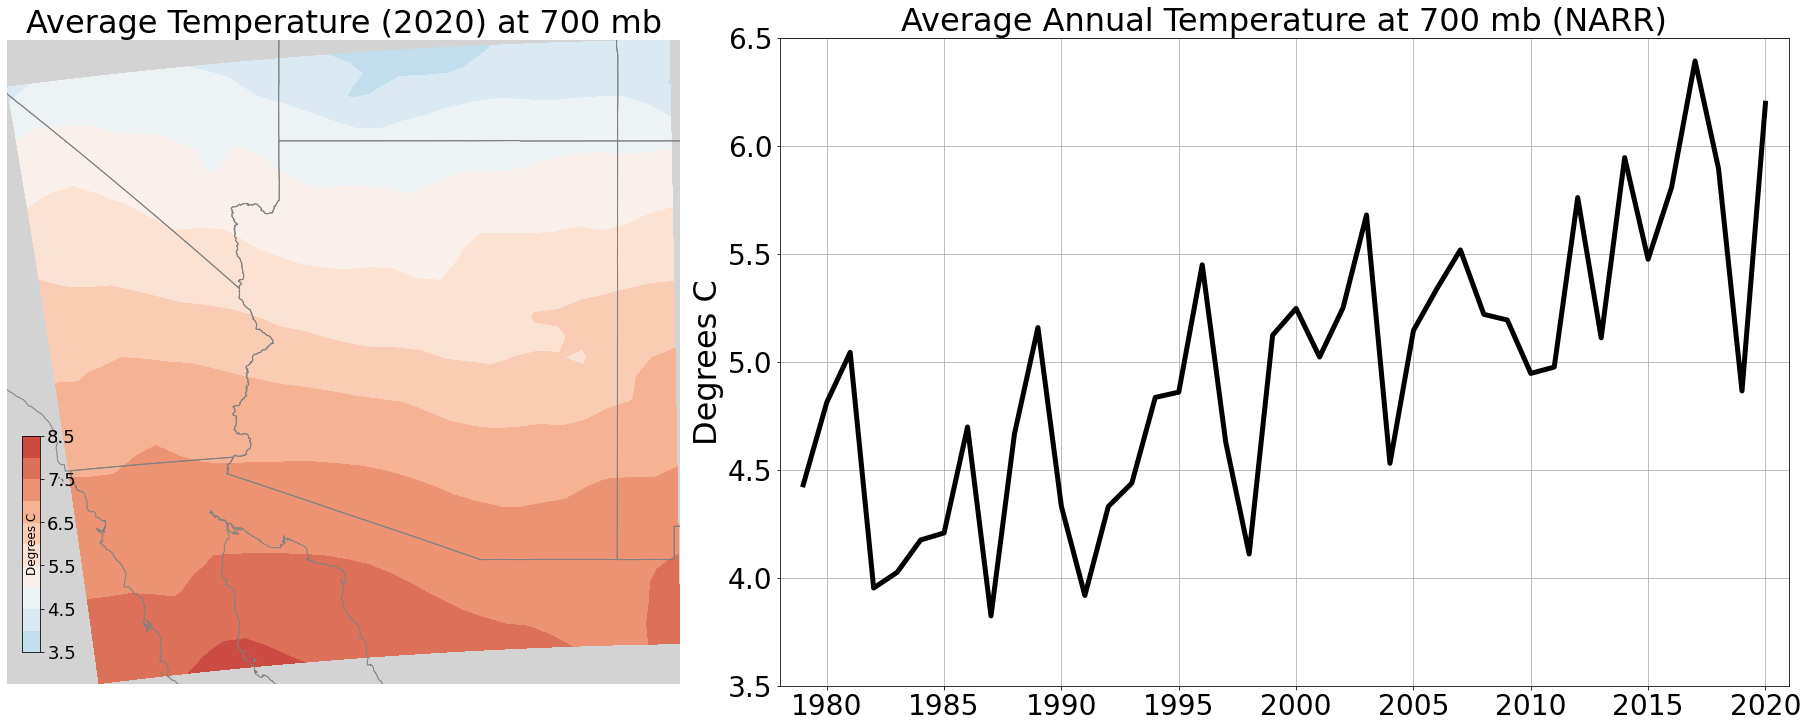
It wasn’t just at the ground that temperatures were at or near record levels in 2020. Assessing temperature data at 700 mb (approximately 10,000 ft MSL) from the North American Regional Reanalysis (NARR, available 1979 to present) over and around Arizona, 2020 was the second warmest on record with an average temperature of 6.2 °C (43.2 °F) (Figure 19). In 2017, temperatures were slightly warmer at 6.4 °C (43.5 °F). Atmospheric temperatures have generally trended upward the past several decades.
Fig. 19. (Left) Average temperature at 700 mb (approximately 10,000 ft MSL) during 2020
over and around Arizona. (Right) Average 700 mb temperature by year for the analysis area.
Since 1990, the trend is +0.5 °C/decade.


 Follow us on YouTube