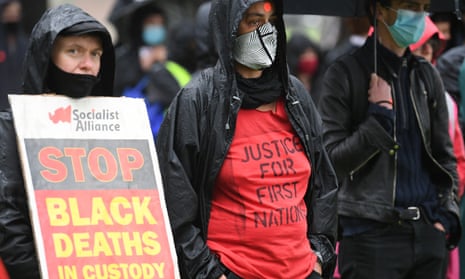
The number of Indigenous Australian prisoners has continued to grow despite an overall reduction in the number of adult prisoners nationally.
The increasing gap between Indigenous and non-Indigenous imprisonment rates has been laid bare in the Productivity Commission’s latest Report on Government Services, which collated data from each state and territory’s justice system.
There were 12,456 Aboriginal and Torres Strait Islander people in prisons across Australia on average from July 2019 to June 2020, up from 11,989 the previous year and 7,507 in 2010-2011.
The Indigenous imprisonment rate is about 1,935 people per 100,000 adults (when adjusted for the average age among Indigenous Australians), an increase from about 1,458 people per 100,000 adults in 2010-2011.
The imprisonment rate for non-Indigenous Australians was about 166 people per 100,000 adults. There were 30,200 non-Indigenous people in prisons across Australia on average from July 2019 to June 2020, a decrease from 30,767 in 2018-2019.
Unlike every other jurisdiction, most prisoners in the Northern Territory are Indigenous, with 1,439 of the 1,731 Australians in prison from July 2019 to June 2020 being Indigenous Australians.
The NT and New South Wales had the highest general rates of imprisonment last year, with 694 and 537 prisoners per 100,000 population, while Victoria had the lowest imprisonment rate, with 234 prisoners per 100,000 population.
Meanwhile, nearly half of prisoners reoffended, with 46% of people released from prison between June 2017 and July 2018 back behind bars within two years. The figure has remained steady in recent years, having been at 44.5% for those released from prisons between June 2012 and July 2013.
The figure increases to 54.9% when also including prisoners released who have entered community corrections programs within two years of their prison release.
Reoffending rates were highest in the NT – where 60.8% of prisoners released between July 2017 to June 2018 returned to prison within two years.
There were nine prisoners who escaped from secure facilities in Australia between July 2019 and June 2020, down from 13 in 2018-19 and 18 in 2015-16.
There were 22 deaths in police custody across Australia between July 2019 and June 2020 – 15 of whom were non-Indigenous people, three were Indigenous, while four are yet to have their identities determined by authorities. In the previous year, there were 24 deaths in police custody, 19 of whom were non-Indigenous, four were Indigenous Australians, and one whose Indigenous status was not known.
The Productivity Commission released its data as Guardian Australia published an investigation series into Indigenous children in custody. A separate investigation in 2020 found there have been at least 434 Indigenous deaths in custody since the Royal Commission into Aboriginal Deaths in Custody ended in 1991.
Previously reported data from NSW has shown police in the state will pursue more than 80% of Indigenous people found with small amounts of cannabis through the courts while letting others off with warnings.
Government expenditure across state and territory justice systems increased to $19.7bn in the 2019-20 financial year, up from $16.6bn in 2015-16. Governments are increasingly spending less on police and more on their prison systems, with corrective services expenditure increasing from $3.9bn in 2015-16 to $5.1bn in 2019-20, in line with a steadily rising prison population.
The Productivity Commission data also included road safety statistics from different states and territories.
Road fatalities fell in the 2019-20 financial year, at 5.6 deaths per 100,000 registered vehicles nationwide, down from 6.1 deaths in 2018-19 and 7.9 deaths in 2010-2011.
The most dangerous roads were in the NT, where there were 19.9 road deaths per 100,000 registered vehicles in 2019-20, compared with just 1.6 deaths in the ACT and 5.7 deaths in NSW in the same year.
The nationwide decrease in road deaths came despite an increase in the number of Australians who admitted to driving more than 10km/h above the speed limit. Between July 2019 and June 2020, 60.7% of Australians admitted to the behaviour in anonymous surveys compiled by police, an increase from 59.8% of drivers the previous year, and up from 55.6% of drivers in 2012-13.
Elsewhere, fire crews in Western Australia took the longest on average to reach a property in a major city after a call for assistance was made – with a median time of 8.8 minutes from the time the call was answered by an operator to when a crew arrived.
In NSW, fire crews responded quicker, with a median arrival time of seven minutes to fires in major cities. This increased to 10 minutes in inner regional and remote areas.
In Victoria, the median fire response time was 6.5 minutes for major cities, 8.1 minutes for inner regional areas, and 7.7 minutes for remote areas.
